ARCTIS - Archaeological Toolbox for Imaging Spectroscopy
ARCTIS is a user-friendly MATLAB® toolbox with a corresponding graphical user interface (GUI) that helps the image analyst – not necessarily a specialist in remote sensing or in imaging spectroscopy – to maximize the information extracted from the recorded 3D data cube. It is a tool to display hyperspectral data (multilayer TIFF images or ENVI files) in many different ways and to retrieve as many pieces of information as possible from the imagery. As such it was created to test currently available AIS processing practices as well as validate the value of completely new information extraction techniques.
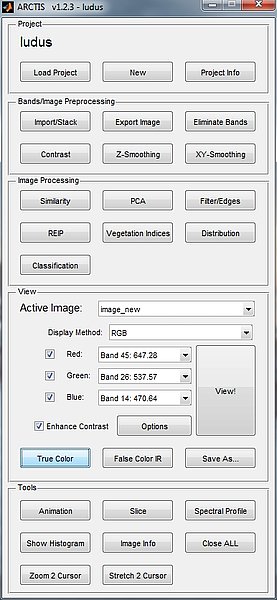
The GUI is divided into five sections, which follow a hypothetical workflow:
Section 1: Project management.
Section 2: Image pre-processing, including image import/export, data stacking, the elimination of specific bands, functions for contrast adjustment and smoothing in z- as well as xy-directions.
Section 3: Image processing functions, grouped into similarity index calculation, principal component analysis, low/high pass filters and edge detection functions, inflection point calculation (see below), vegetation index calculation, distribution fitting (see below) and (k-means) data clustering.
Section 4: Display control, visualization and Output.
Section 5: Contains several tools which are believed to be helpful for image analysis, such as displaying an animated sequence of the 3D data cube, viewing data along slices, and displaying spectral profiles of selected pixels.

This work is licensed under a Creative Commons Attribution 4.0 International License.
The toolbox can be used free of restrictions under the Creative Commons Attribution 4.0 International License. This means that you can use it for any purpose. No warranties are given. An easy-to-read summary of the license can be found here.
We request that you actively acknowledge our work by quoting following open access publications:
- Atzberger C., Wess M., Doneus M., Verhoeven G., 2014. ARCTIS—A MATLAB® Toolbox for Archaeological Imaging Spectroscopy. Remote Sens. 2014, 6, 8617-8638; doi:10.3390/rs6098617
- Doneus M., Verhoeven G., Atzberger C., Wess M., Ruš M., 2014. New ways to extract archaeological information from hyperspectral pixels, Journal of Archaeological Science (2014), doi: 10.1016/j.jas.2014.08.023.
If you publish visualizations of the test data, please add "(data source: LBI ArchPro & ABT GmbH)" to the figure caption.
Download ARCTIS
- ARCTIS stand alone programme: ARCTIS_installer_web will open an installation routine, which will search for the needed MATLAB Compiler Runtime(MCR) and - if necessary - download and install it. (> 400 M).
- MATLAB® code (source code) - tested with version R2011b (7.13.0.564) and R2014a (8.3.0.532). Will work within the MATLAB environment.
- User Documentation
- Testdata (© LBI ArchPro)
Metadata for testdata
| Copyright | LBI ArchPro & ABT GmbH |
| Case Study Area | Carnuntum |
| Date of data acquisition | 26 May 2011 |
| Purpose of scan | Archaeology |
| Imaging spectrometer | AisaEAGLE (SPECIM) |
| Number of bands | 65 |
| Spectral sampling interval | 8.6 to 9.5 nm |
| Spectral resolution | 3.3 nm at FWHM |
| Spectral range | 403-995 nm |
| Binning | 8 |
| Flying height above ground | 600 m |
| Ground Sampling Distance | 0.4 m |
| Speed of aircraft | 50 m/sec |
| Digitisation | 12-bit |